Extracting VMware Velocloud SD-WAN events with Elastic Stack
The Velocloud Orchestrator provides a huge amount of telemetry across the network. However often (pretty much always in my experience), an Enterprise IT environment contains more than a WAN. Many organisations use Elastic stack to provide centralized log aggregation and analytics across their IT entire environment.
The VCO has been built as an API first platform, meaning anything we can do in the UI is ultimately an API call that our web browser is making to the VCO. This means
In this guide, we'll setup Filebeats to poll the Velocloud orchestrator for new events and push them into the Elasticsearch via Logstash. I've used docker, for ease of development, but the principals hold true in a production environment.
Before you get started you will need:
- A Velocloud Orchestrator login and API key
- Docker installed either on your local machine or access to a docker environment
Pro-tip: If you're working on a desktop OS with docker, you'll need to increase the docker engine maximum RAM to 4G. Don't do what Skinny did and skim the doco, only to spend 2 hours wondering why your Elasticsearch container keeps crashing.
The Project
We'll be using the below directory structure for our project:
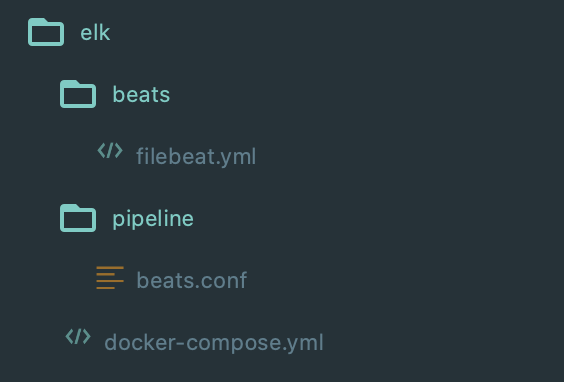
docker-compose.yml
First up we'll need a docker-compose file to define our environment
 1version: '2.2'
 2services:
 3  es01:
 4    image: docker.elastic.co/elasticsearch/elasticsearch:7.9.3
 5    container_name: es01
 6    environment:
 7      - node.name=es01
 8      - discovery.type=single-node
 9    ports:
10      - 9200:9200
11
12  kib01:
13    image: docker.elastic.co/kibana/kibana:7.9.3
14    container_name: kib01
15    ports:
16      - 5601:5601
17    environment:
18      ELASTICSEARCH_URL: http://es01:9200
19      ELASTICSEARCH_HOSTS: http://es01:9200
20
21  lstash01:
22    image: docker.elastic.co/logstash/logstash:7.9.3
23    container_name: lstash01
24    volumes:
25      - ./pipeline:/usr/share/logstash/pipeline
26    ports:
27      - 5044:5044
28
29  beat01:
30    image: docker.elastic.co/beats/filebeat:7.9.3
31    container_name: beats
32    volumes:
33      - ./beats/filebeat.yml:/usr/share/filebeat/filebeat.yml
beats/filebeat.yml
Our filebeat config file is broken into 3 parts:
- Config: General configuration items for filebeats
- Inputs: Our list of data sources for filebeats
- Output: Where we want to send data, in our case Logstash
 1filebeat.config:
 2  modules:
 3    path: ${path.config}/modules.d/*.yml
 4    reload.enabled: false
 5
 6filebeat.inputs:
 7  - type: httpjson
 8    url: https://<orchestrator-url>/portal/rest/event/getEnterpriseEvents
 9    interval: 5m
10    http_method: POST
11    http_headers:
12      Authorization: '<your api key goes here>'
13    json_objects_array: data
14    http_request_body:
15      enterpriseId: <enterpriseid (you can use 0 if you're an end customer)>
16
17output.logstash:
18  hosts: ["lstash01:5044"]
pipeline/beats.conf
This is our logstash pipeline file. It tells logstash where to listen for data, how to filter/transform it and ultimately where to send it.
 1input {
 2	beats {
 3		port => 5044
 4	}
 5}
 6
 7filter {
 8	json {
 9		source => "message"
10	}
11}
12
13output {
14	elasticsearch {
15		hosts => ['http://es01:9200']
16		index => "%{[@metadata][beat]}-%{[@metadata][version]}-velo-events"
17		document_id => "%{[id]}"
18	}
19}
Getting up and running
First we need to bring up our docker environment with docker-compose
After roughly 2 minutes you should be able to access Kibana by browsing to http://localhost:5601
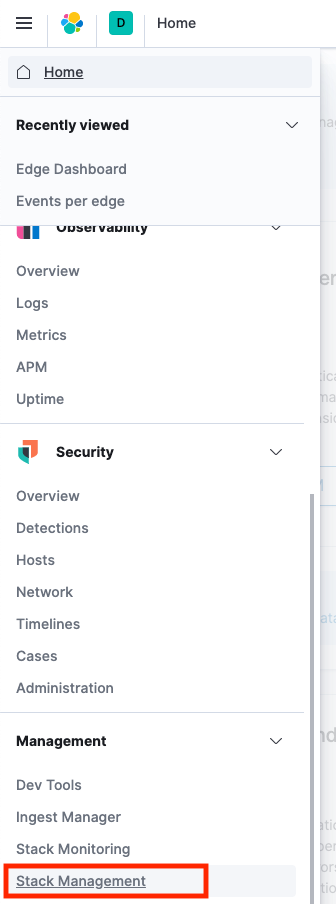
Once you're in, you'll need to create an index pattern so that Kibana knows which index to use for analytics. From the main menu scroll down to 'Stack Management'
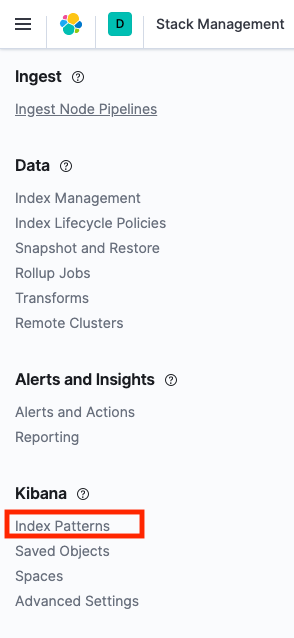
Then go to 'Index Patterns'
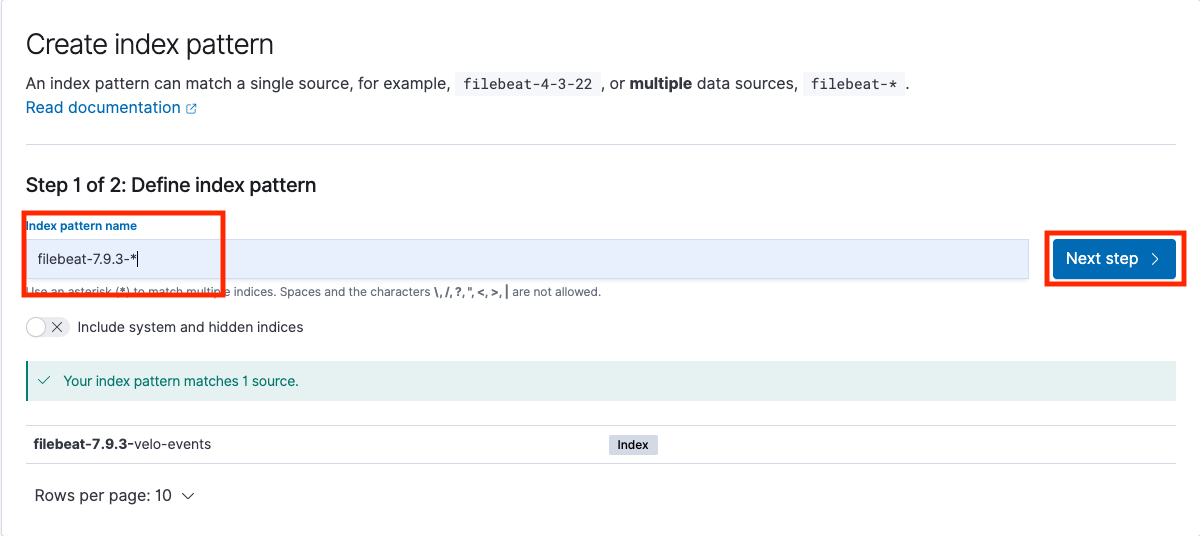
Create a new index pattern matching the filebeat index
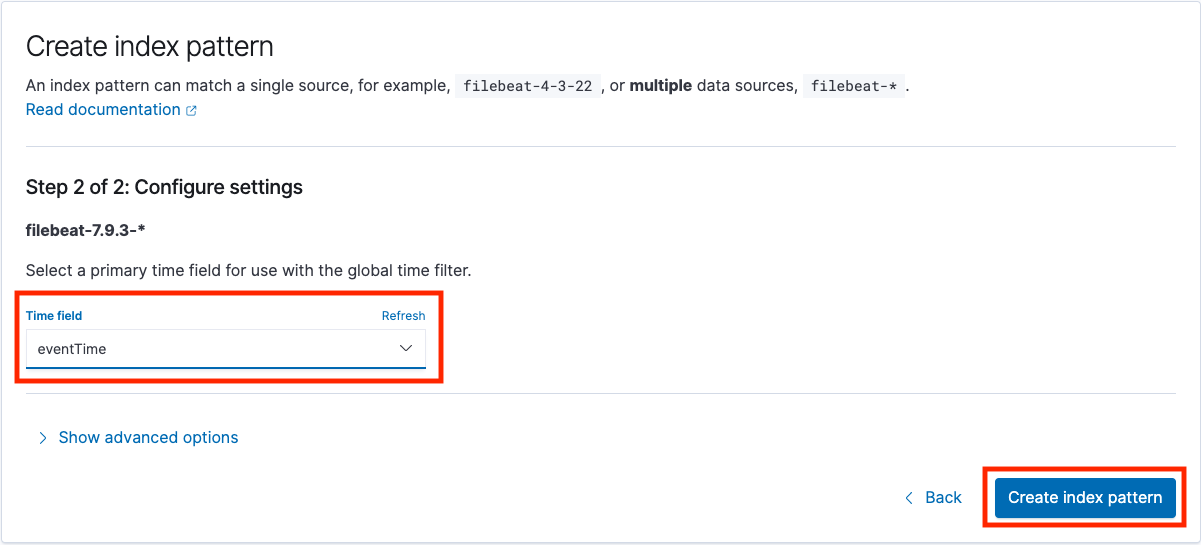
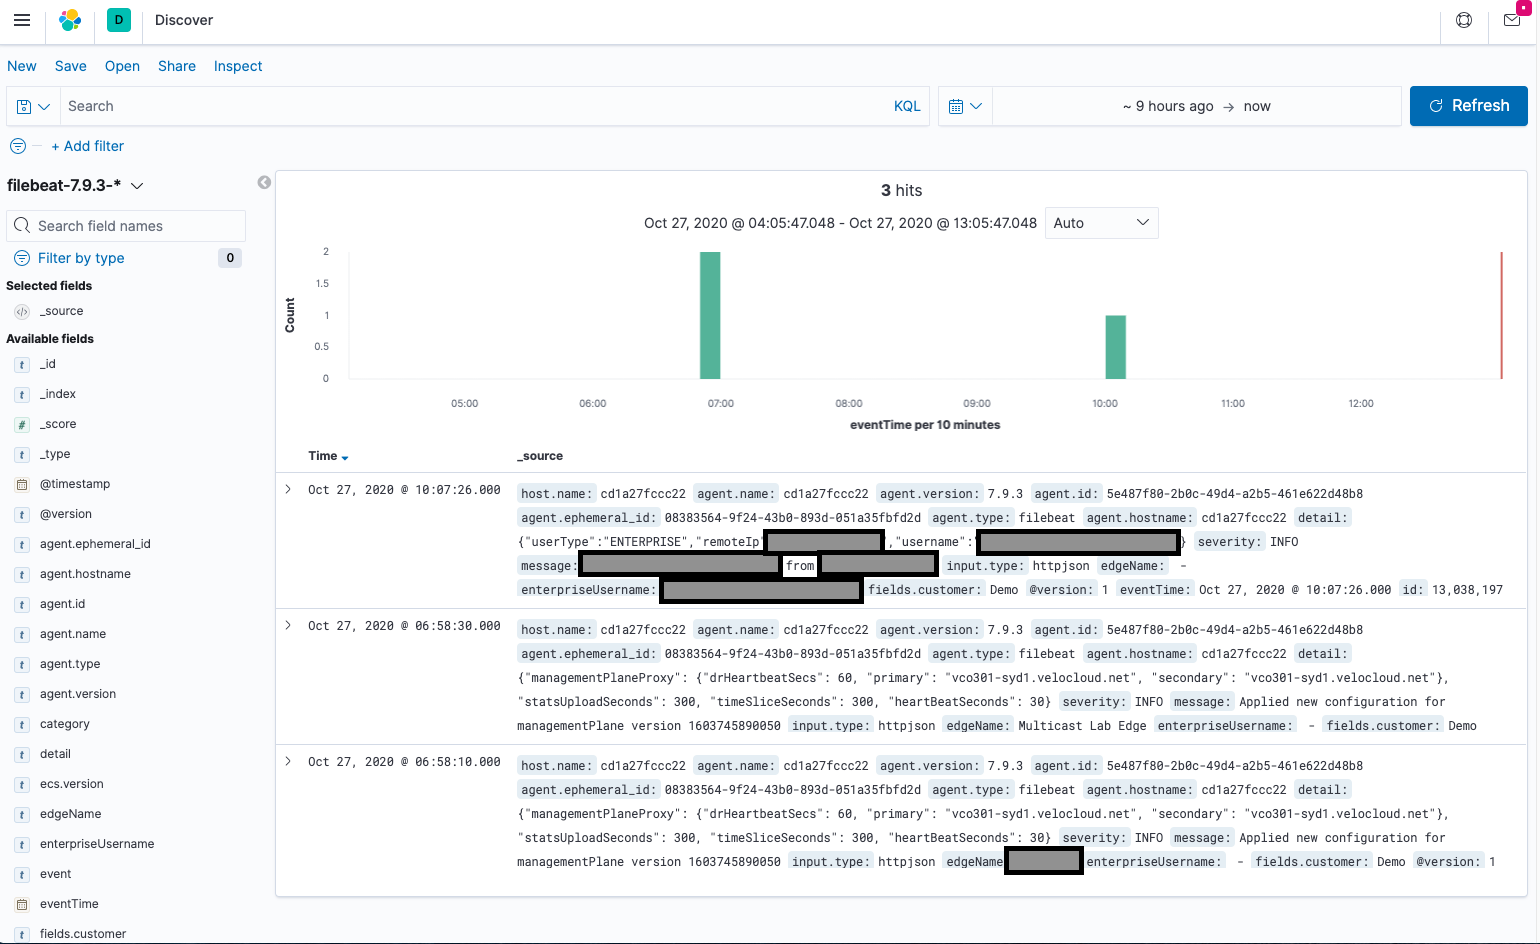
From the menue select Kibana->Discover. If everything went correctly you should have a list of events (note, by default the events/getEnterpriseEvents API call gets the last 12 hours of events, so you may need to increase the time window for events to show up).
Additional Resources
- VMware Developer Site - https://code.vmware.com/apis/1045/velocloud-sdwan-vco-api
- Running the Elastic Stack on Docker - https://www.elastic.co/guide/en/elastic-stack-get-started/current/get-started-docker.html