Exporting Application Data from the Velocloud Orchestrator
One of the major benefits the organisations find when they transition to a SD-WAN based network architecture is that they have increased visibility into which applications are flowing over their network. Gone are the days of having to try to piece together NETFLOW or SFLOW data, with graphs out of your NMS to figure out which application killed the network at 2pm.
That said data storage == $, and as of as of version 3.3.2 VMware only retain 14 days of flow data for customers on VMware hosted orchestrators. Whilst this is useful for viewing and troubleshooting the SD-WAN environment in the here and now, organisations may wish to retain their flow data for longer periods of time for many reasons including:
- Troubleshooting historic issues
- Analyzing network changes over time
- Creating custom reports that aren't available out of the box
- Correlating data from different systems
Thankfully, the VCO API comes to the rescue yet again by enabling us to export this data from the orchestrator and into our own time series database. In this article we'll explore using python, some scripts I've made open source and influxdb.
Note: This guide assumes you're executing these scripts in the context of an end customer.
Before you get started you will need:
- A Velocloud Orchestrator login and API key
- The API Key stored in an environmental variable called VCOAPIKEY
- Docker installed either on your local machine or access to a docker environment
- A rudimentary understanding of Python and Docker
Getting started
First thing we need to do is download example docker-compose file and python scripts, and install the python dependancies:
1git clone --recursive https://github.com/Brayneded/skinnynettech-velo-influx
2cd skinnynettech-velo-influx
3pip install -r requirements.txt
This assumes your local python is running version 3+. if your on MacOS using python3 through homebrew you might need to use pip3/python3 throughout the rest of this guide
We need to start up our influxdb environment in docker:
1docker-compose up -d
Once our docker environment is up, we need to add our VCO to the sync.py file so that the script knows which orchestrator to talk to (Make sure you use the https:// in the url):
1# Create a VCO client
2vco_client = vcoclient.VcoClient('<your vco goes here>')
Then we run our script:
1python3 sync.py
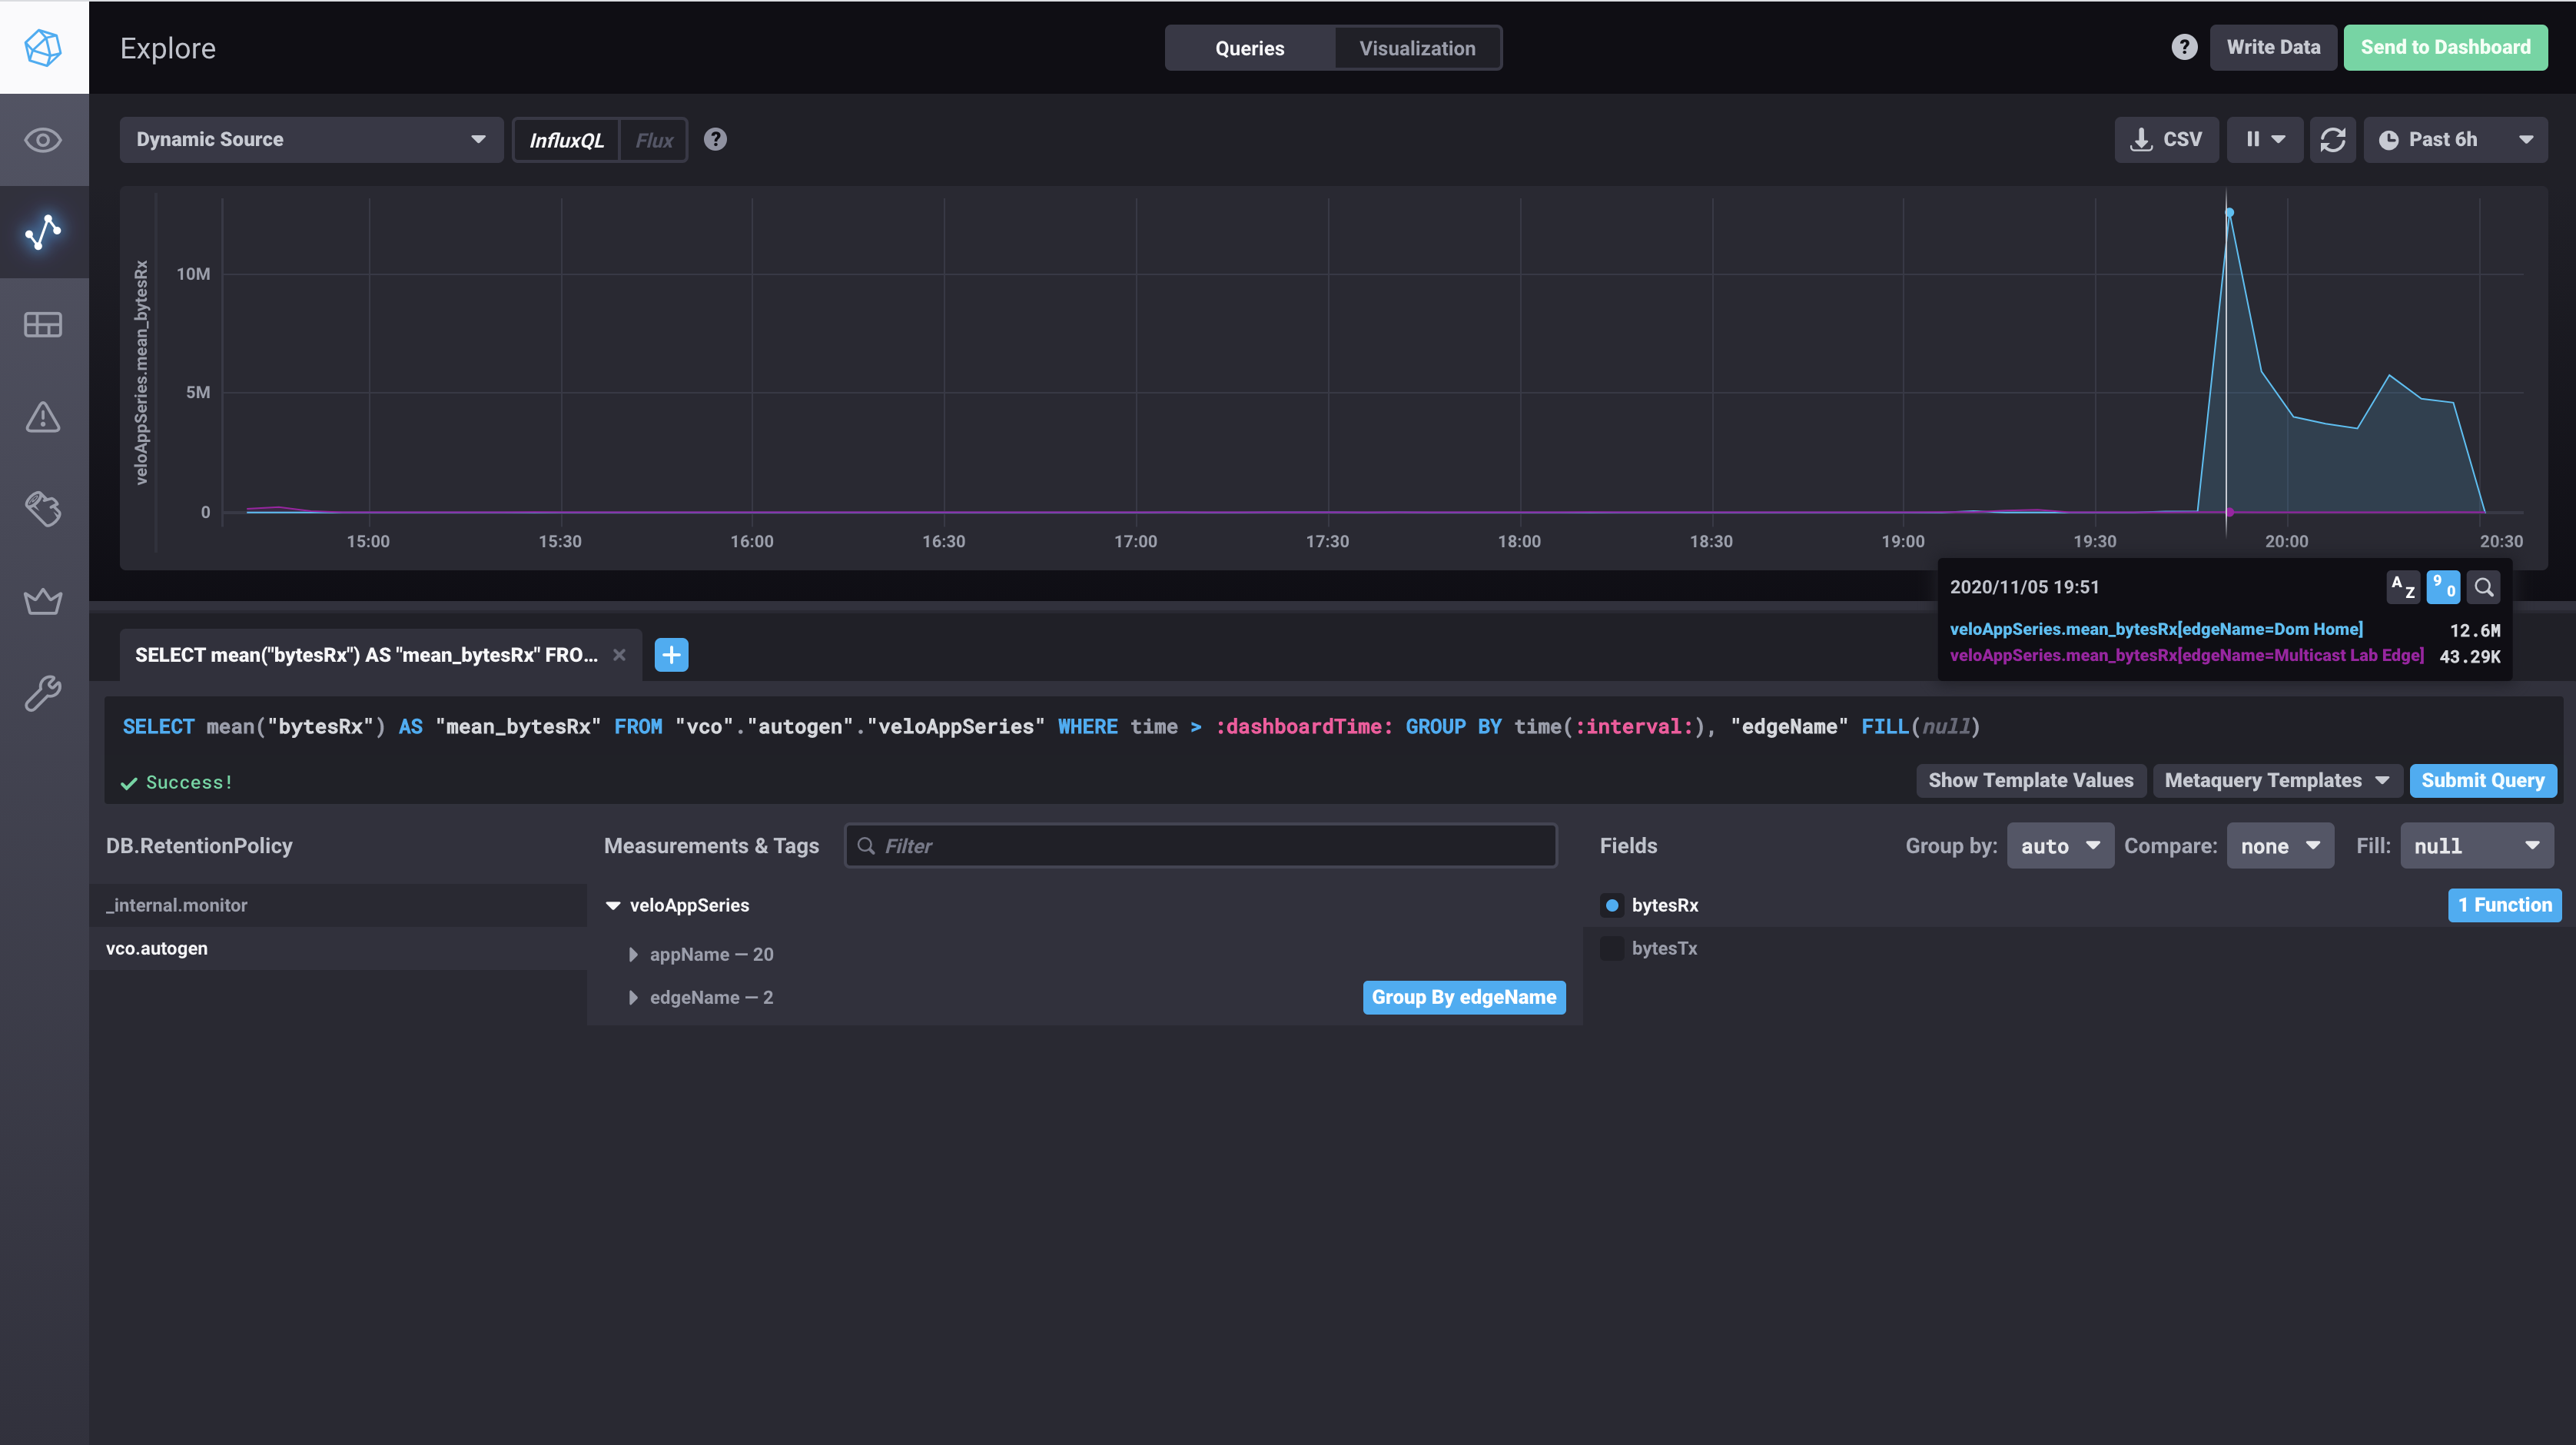
If all went well the script should complete without any errors. If you now browse to http://localhost:8888/sources/0/chronograf/data-explorer you should be able to start exploring the last 12 hours of edge application data in chronograf:
How does it work under the hood.
We need to make a few API calls to get the raw data flow data out of the Orchestrator.
Ultimately the REST endpoint we call is /metrics/getEdgeAppSeries, however by default the method only returns the top 10 applications' data, and returns an other application that rolls up any other application utilization.
In order to get all of the application flow data out we first need to call metrics/getEdgeAppMetrics to get a list of all the applications that the edge saw over the interval we're interested in and then specify the applications we're interested explicitly in the /metrics/getEdgeAppSeries call.
Side note: As at 4.1.0, if you're playing around with the orchestrator API yourself keep in mind that whilst the VCO will take either a UNIX timestamp or a RFC3339 formated datetime input, it is highly inconsistent with the date format that's returned. As an example the /metrics/getEdgeAppSeries call returns a UNIX timestamp, where /metrics/getEdgeLinkSeries returns a RFC3339 datetime string
Additional Resources
- VMware Developer Site - https://code.vmware.com/apis/1045/velocloud-sdwan-vco-api
- Script Repo - https://github.com/Brayneded/skinnynettech-velo-influx